Just-in-time compilation
How is java code executed
JVM converts Java code into machine code
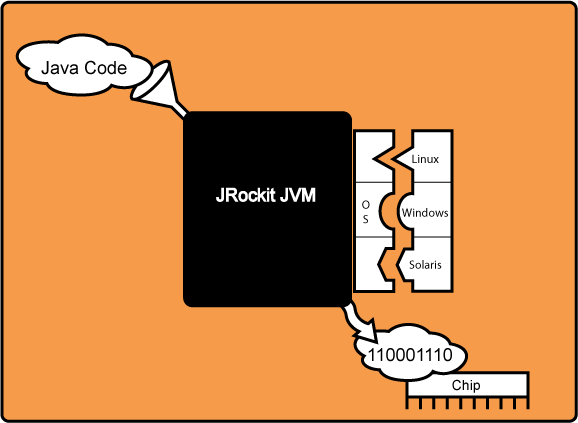
JVM converts Java code into machine code
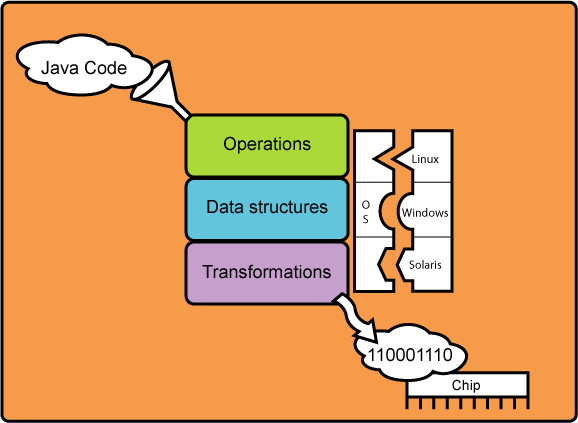
Code conversion is not one time process
Its Just-In-Time
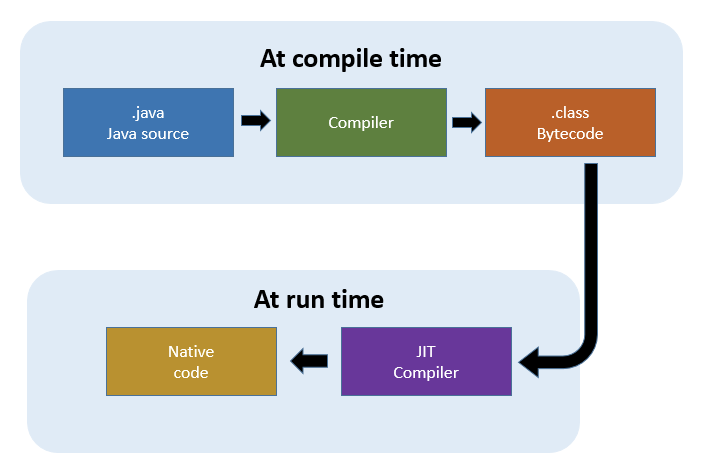
Code compilation at run time is Slow
Do it only if needed
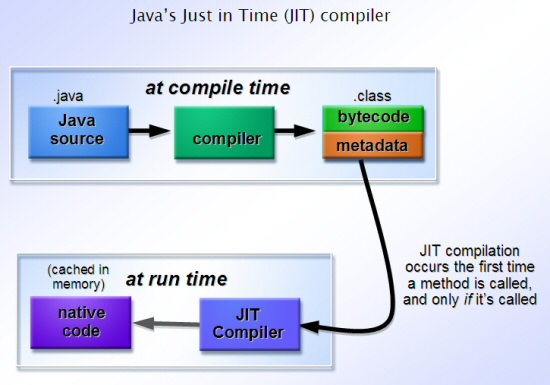
Store results of compilation for future use

Premature optimization is the root of all evil.
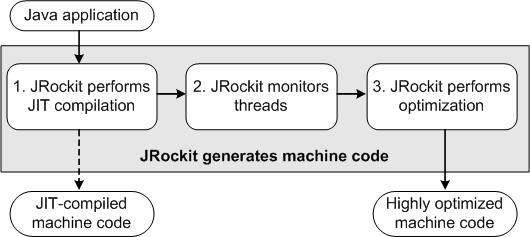
JIT Optimizations
JIT optimizes hotspots
Heavily used methods and loops
How does JIT find hotspots
JIT is composed of tiers
level 0 - interpreter
level 1 - C1 with full optimization (no profiling)
level 2 - C1 with invocation and backedge counters
level 3 - C1 with full profiling
level 4 - C2
private static final int LOOP_COUNT = 5000;

public static void main(String[] args) {
	for (int i = 0; i < 1000; ++i) {
		long startTime = System.nanoTime();

		for (int j = 0; j < LOOP_COUNT; ++j) {
			new Object();
		}

		long endTime = System.nanoTime();
		System.out.printf("%d\t%d%n", i, endTime - startTime);
	}
}
javac test/HotLoops.java && java test.HotLoops
0	224194
1	197060

19	66723
20	78074

59	1737
60	1747

996	2699
997	3261
998	2465
999	3111
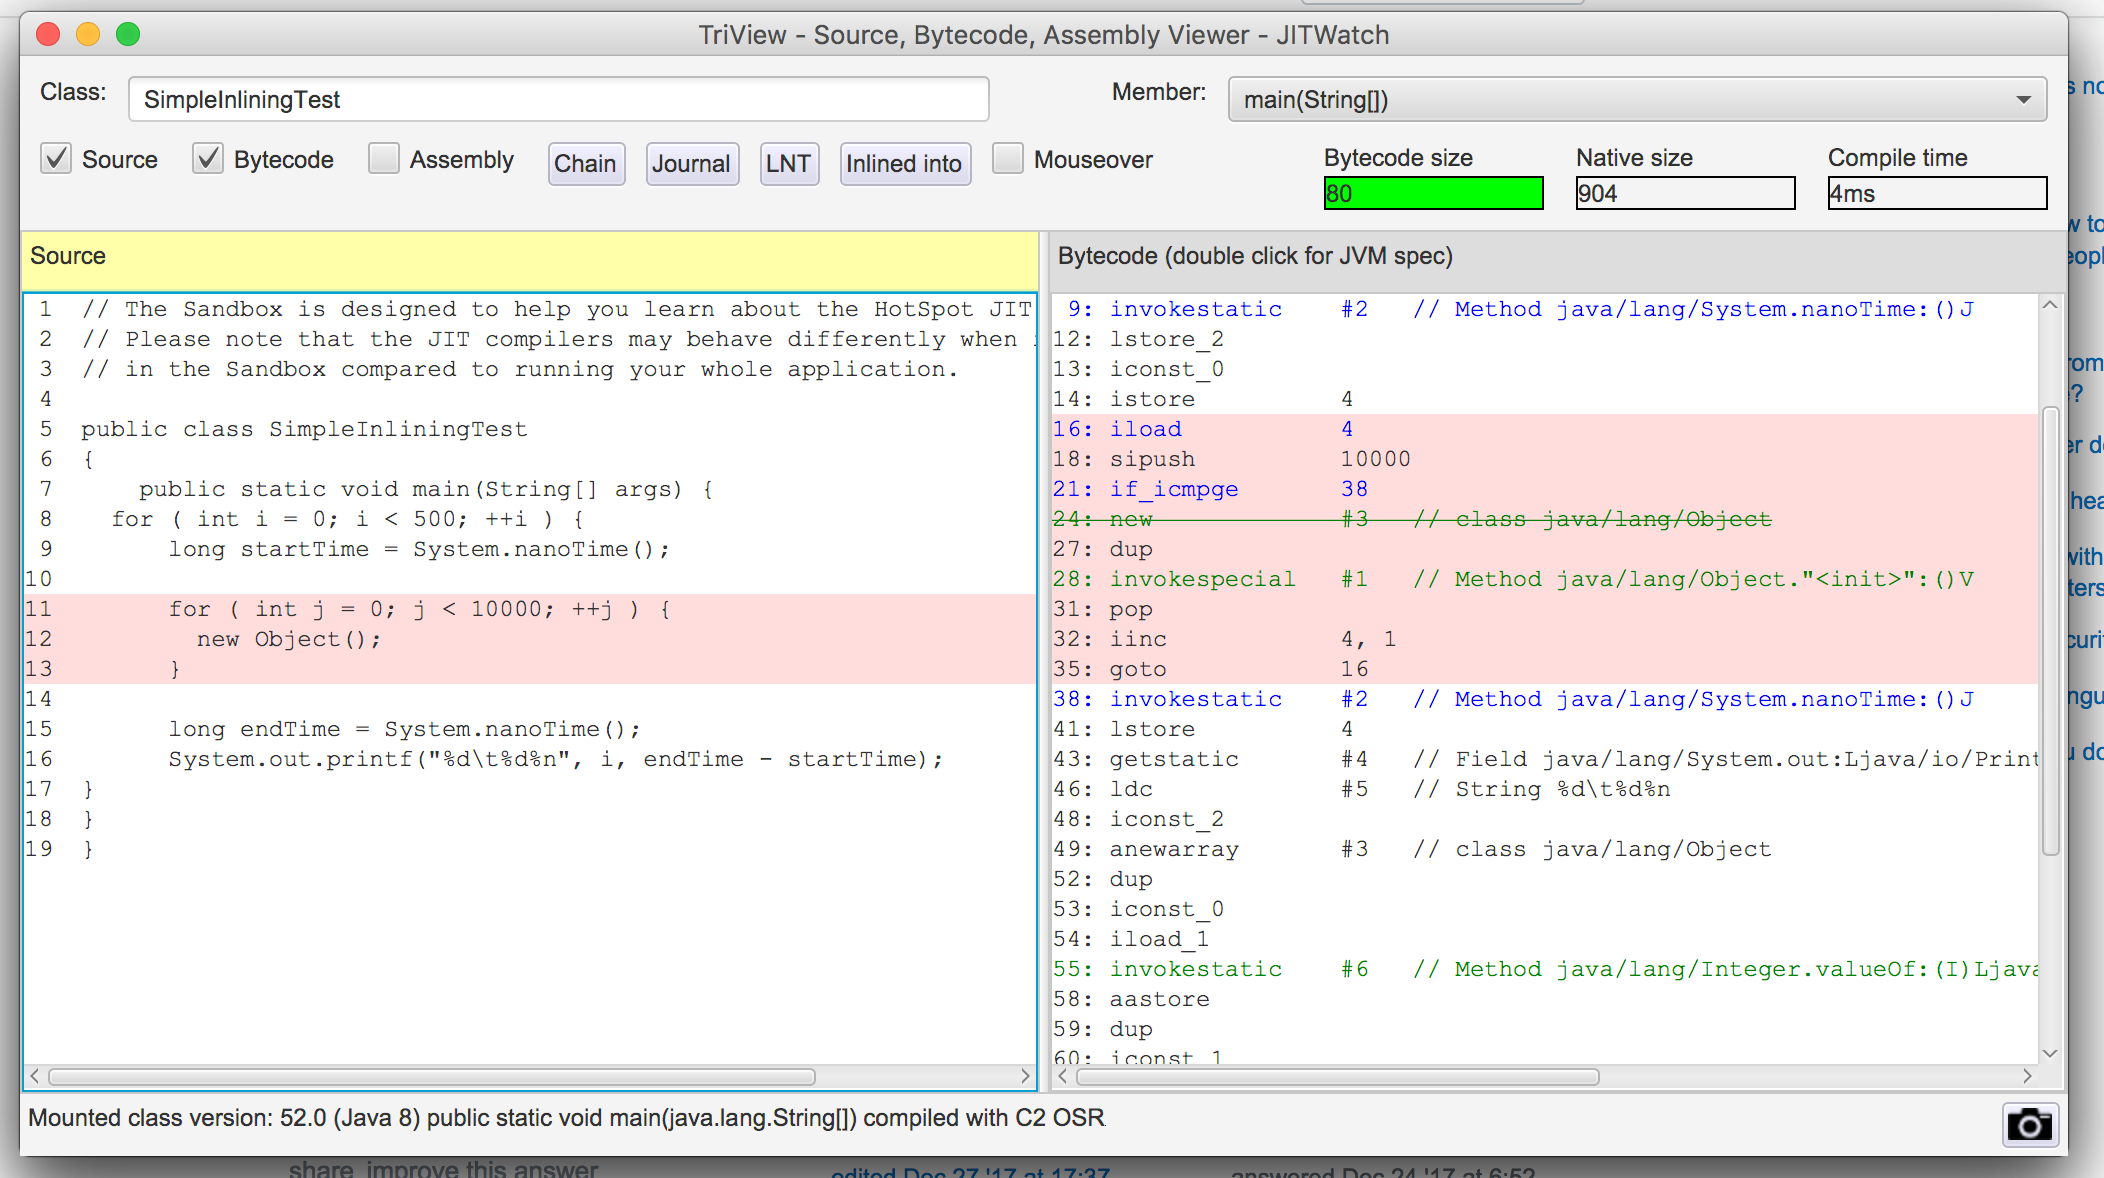
JIT gets rid of the inner loop
Few extra things
- Ultimate goal is to either reach tier 1 or tier 4
- Made not entrant flag used to invalidate using compiled code from cache
Throwing JIT for a loop
Introduce branch condition which is false most of the times
private static final int LOOP_COUNT = 10000;

public static void main(String[] args) {
	for (int i = 0; i < 1000; ++i) {
		long startTime = System.nanoTime();

		for (int j = 0; j < LOOP_COUNT; ++j) {
			Object x = new Object();
			if (i == 900) {
				x = null;
			}
		}

		long endTime = System.nanoTime();
		System.out.printf("%d\t%d%n", i, endTime - startTime);
	}
}
69	128783
70	133282
71	139054
72	162974
73	154268
74	52
75	50
76	49
77	47
897	39
898	40
899	40
900	571824
901	322669
902	233286
903	162727
Null checks
How to handle nulls
What if value is null?
static final void hotMethod(final Object value) {
	value.hashCode();
}
JIT assumes absence of nulls
public static void main(String[] args) throws InterruptedException {
	for (int i = 0; i < 20_000; ++i) {
		hotMethod("hello");
	}

	Thread.sleep(5_000);
	int count = 0;

	for (int i = 0; i < 1000; ++i) {
		System.out.printf("tempting fate %d%n", i);
		try {
			hotMethod(null);
		} catch (NullPointerException e) {
			// ignore
		}
	}
}

static final void hotMethod(final Object value) {
	value.hashCode();
}
Output
tempting fate 0
tempting fate 1
tempting fate 2
tempting fate 3
	5178  111       4       test.NullJIT::hotMethod (6 bytes)   made not entrant
tempting fate 4
	5178  193       3       java.util.Arrays::copyOfRange (63 bytes)
tempting fate 5
tempting fate 6
We usually see this in adserv logs, exceptions without stack traces
java.lang.NullPointerException
java.lang.NullPointerException
java.lang.NullPointerException
java.lang.NullPointerException
java.lang.NullPointerException
java.lang.NullPointerException
This is JIT optmizing for throwing exceptions.
Summary
- Code at runtime goes through the interpretor and then to JIT
- JIT works in tiers
Garbage collection uses optimizations done by JIT to stop the world